Published: 15 Oct 2019 | Author: James Honner
A great way to take your Power BI Reports to the next level is by using PowerBI Tooltips. Report Page ToolTips (RPT). RPT’s allow you to enhance your reports by giving your end users more information without taking up any real estate, cluttering the report canvas.
In the example below, we have a donut chart showing Revenue FYTD by Region. One great way to enhance visual this is to add a RPT showing the Top 5 Stores for each Region as your end users hover over the donut chart.
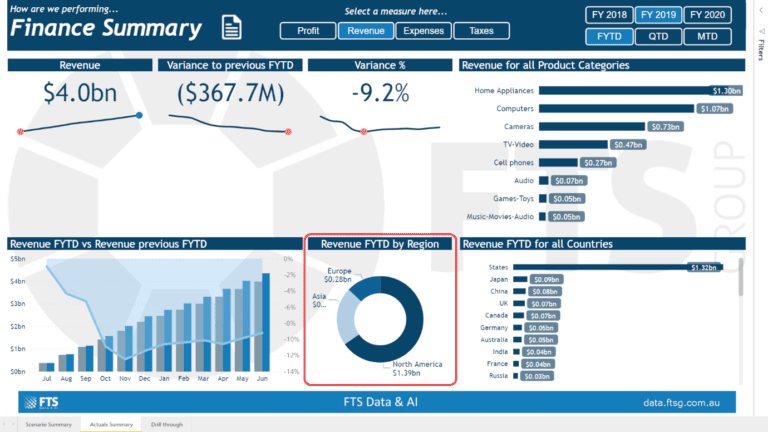
Target visual for PowerBI Tooltips
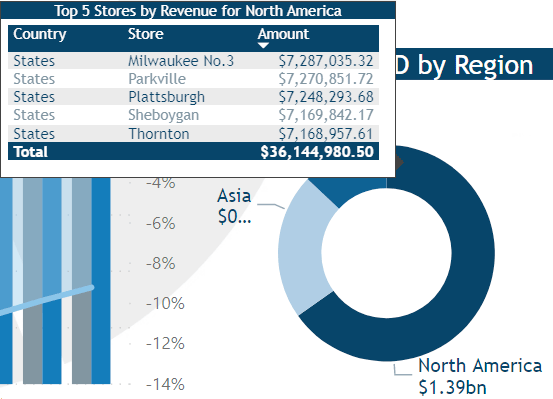
In the example below we’ve hovered over the ‘North America’ Region and the RPT shows us the Top 5 Stores by Revenue FYTD for that Region.
Tooltips in Action
When we hover over the different Regions the RPT changes to show the Top 5 Stores for that Region.
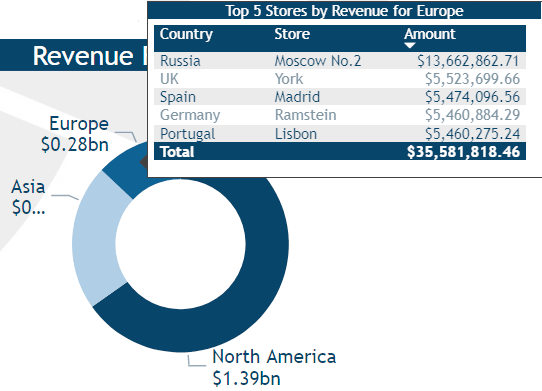
PowerBI Tooltips Changing context
As well as the RPT, we have setup a drill through on this donut chart and can still perform this action by right clicking and selecting the drillthrough option as shown below.
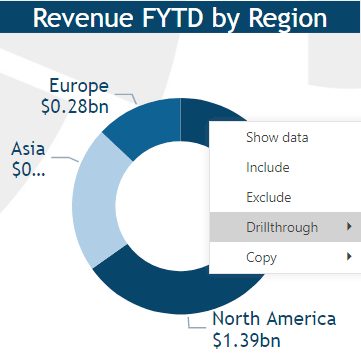
Drilling through for more detail
In our second example, we demonstrate that RPTs can also be used on bar charts. This bar chart shows Revenue FYTD by Country and when you hover over a Country the RPT shows the Revenue FYTD by month for that Country. These also change as you hover over the different Countries.
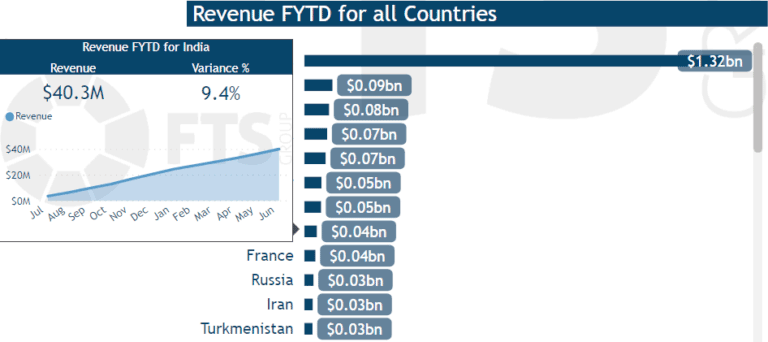
PowerBI Tooltips on a different visual
NB: This report also has dynamic measures and visual titles which we will cover in upcoming blogs.
In only a few steps you can create PowerBI Tooltips (RPT’s) in your reports, so let’s go through those steps now.
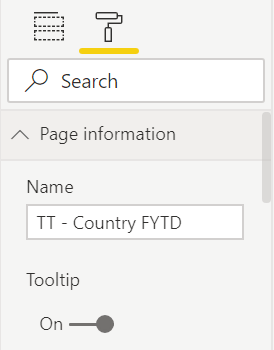
Enabling PowerBI Tooltips
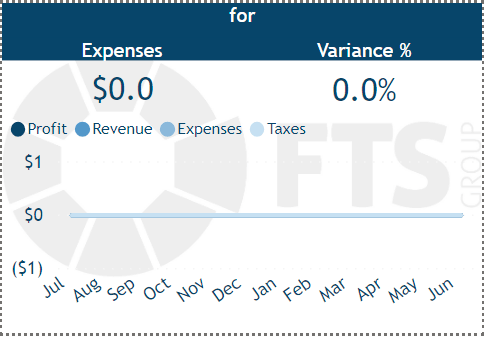
Defining PowerBI Tooltips size

Hiding the PowerBI Tooltips page
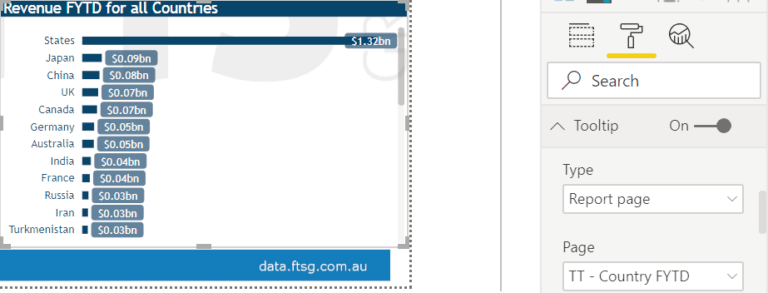
Linking the PowerBI Tooltips to a visual
And you’re done! It’s as simple as that.
In upcoming blogs we’ll go through some more advanced concepts, dynamic measures/attributes as well as dynamic visual titles so stay tuned for that.
If you’d like to take your Power BI Reports and Dashboards to the next level and need help, please contact us to discuss how we can assist your organisation.

Get the latest Talos Newsletter delivered directly to your inbox
TECHNOLOGY PARTNERS
Our partners including Microsoft, UiPath, Databricks & Profisee enable us to deliver business outcomes using best of breed technologies and solutions.

Automation & Analytics Technologies for Business

Australian councils face backlogs, staff turnover, and rising community expectations. We help you improve service delivery and operational efficiency through process automation — integrated with TechnologyOne, Civica, and Pathway.

Talos helps organisations build reporting solutions using Jet Analytics
Talos helps organisations build modern data and analytics platforms using Databricks, Microsoft Fabric and Power BI. We work from strategy through implementation, ensuring you get value from the platform without unnecessary complexity.