Published: 09 Jan 2020 | Author: James Honner
A great way to take your Power BI Reports to the next level is by making them fully interactive by incorporating PowerBI dynamic measures & dimensions. With this clever use of DAX, it’s possible to slice your data the way you want without leaving the dashboard screen.
In this 2-part series we’ll look at creating dynamic measures & dimensions within your PowerBI reports in part 1 and then continuing that into visual titles in part 2.
Using this concept greatly enhances the end user experience as they can monitor/analyse multiple measures and dimensions in a single report page at the click of a button making this a highly desirable solution.
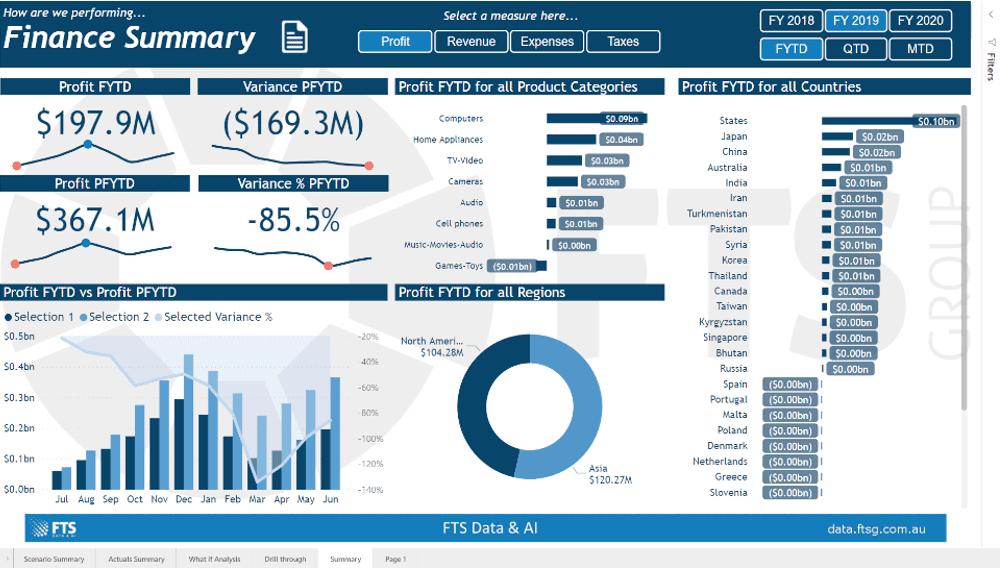
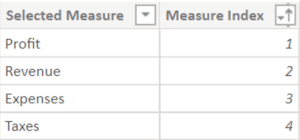
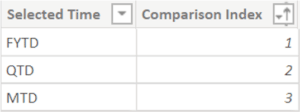
In the PowerBI report example below, we have a financial dataset which includes revenue, expenses & taxes and from these we can calculate profit. We have created 1 set of measures for profit, revenue, expenses & taxes and 1 dimension for the time periods Fiscal Year to Date (FYTD), Quarter to Date (QTD) and Month to Date (MTD).
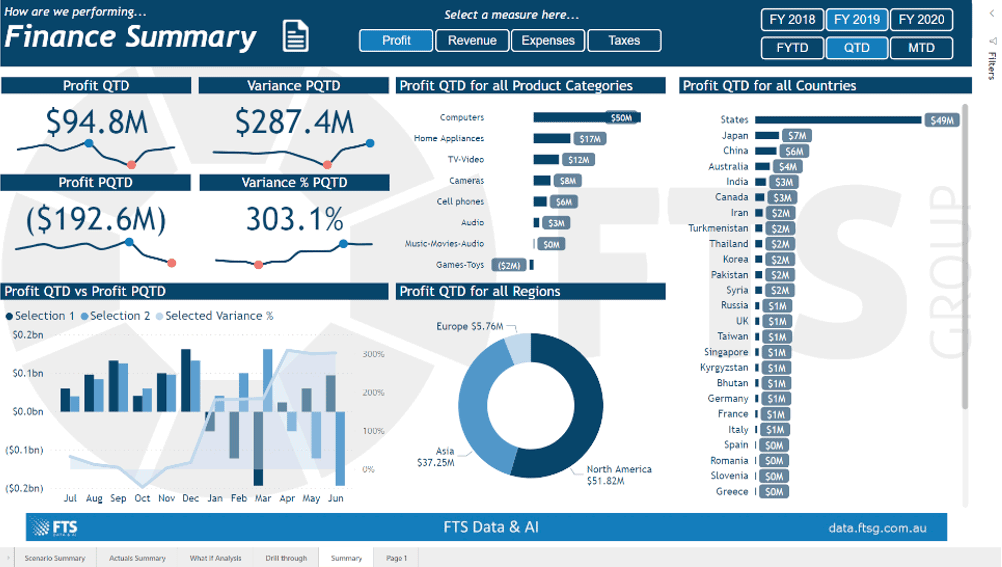
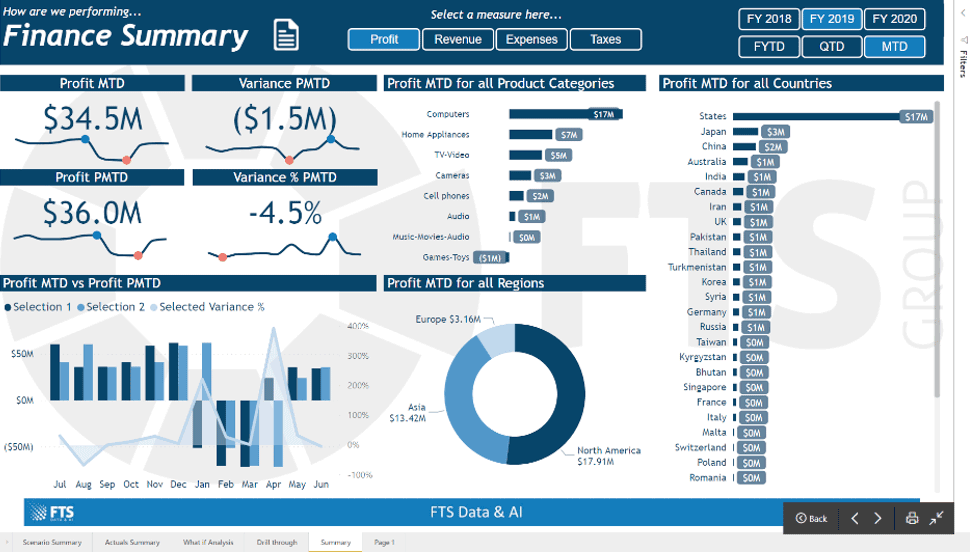
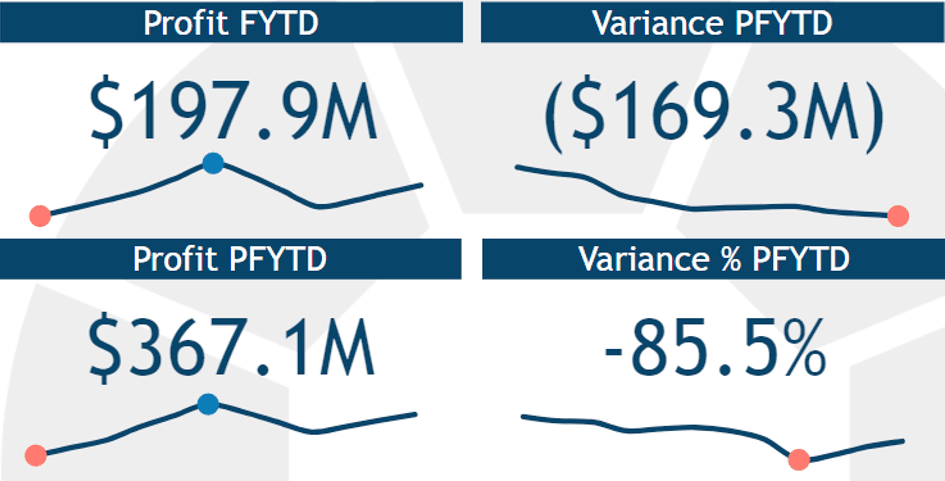
This will allow end users to view, as seen in the examples below, Profit by FYTD or QTD or MTD as well as the variances to the previous FYTD or QTD or MTD and all the visuals and visual titles will update when a different measure or time period is selected.
Profit FYTD
Profit QTD
Profit MTD
How to
There are quite a few steps involved to get this concept up & running but the benefits to your report consumers will be well worth the effort.
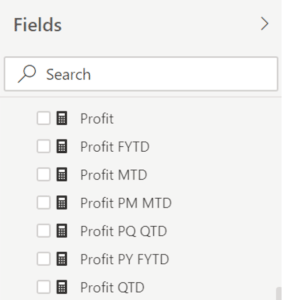
Dynamic Measures table
Dynamic Dimensions table
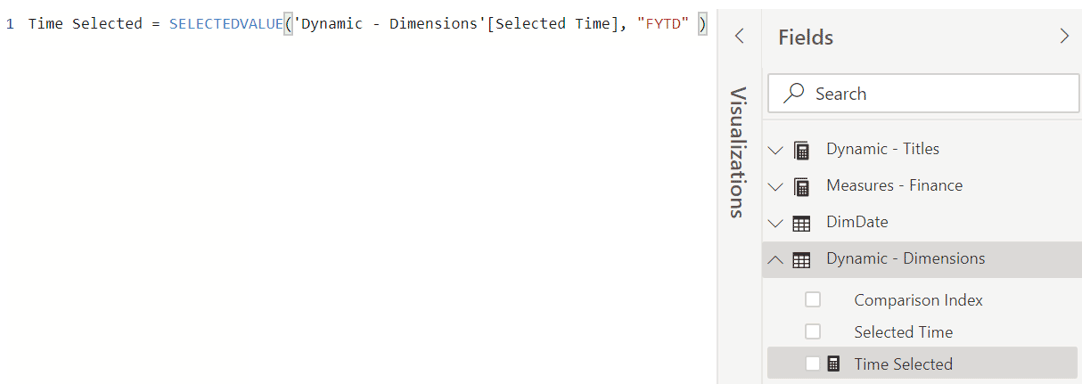
Below is the Time Selected measure.
Bringing it all together
Using your preferred slicer, in this example the Chiclet Slicer (available via the PowerBI Marketplace), we create 2 slicers, one for the Selected Measure and one for Selected Time . These slicers allow your report consumers to dynamically change measures & time periods within the report page.
Below is the Selected Measure Chiclet Slicer.
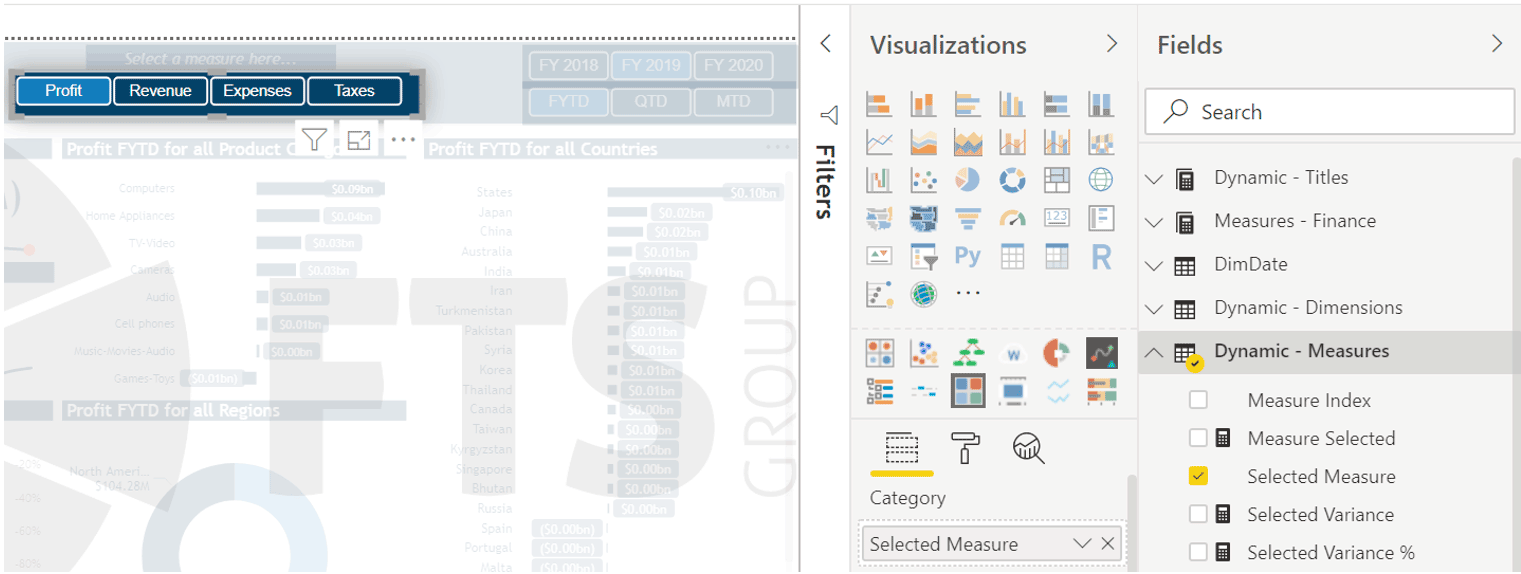
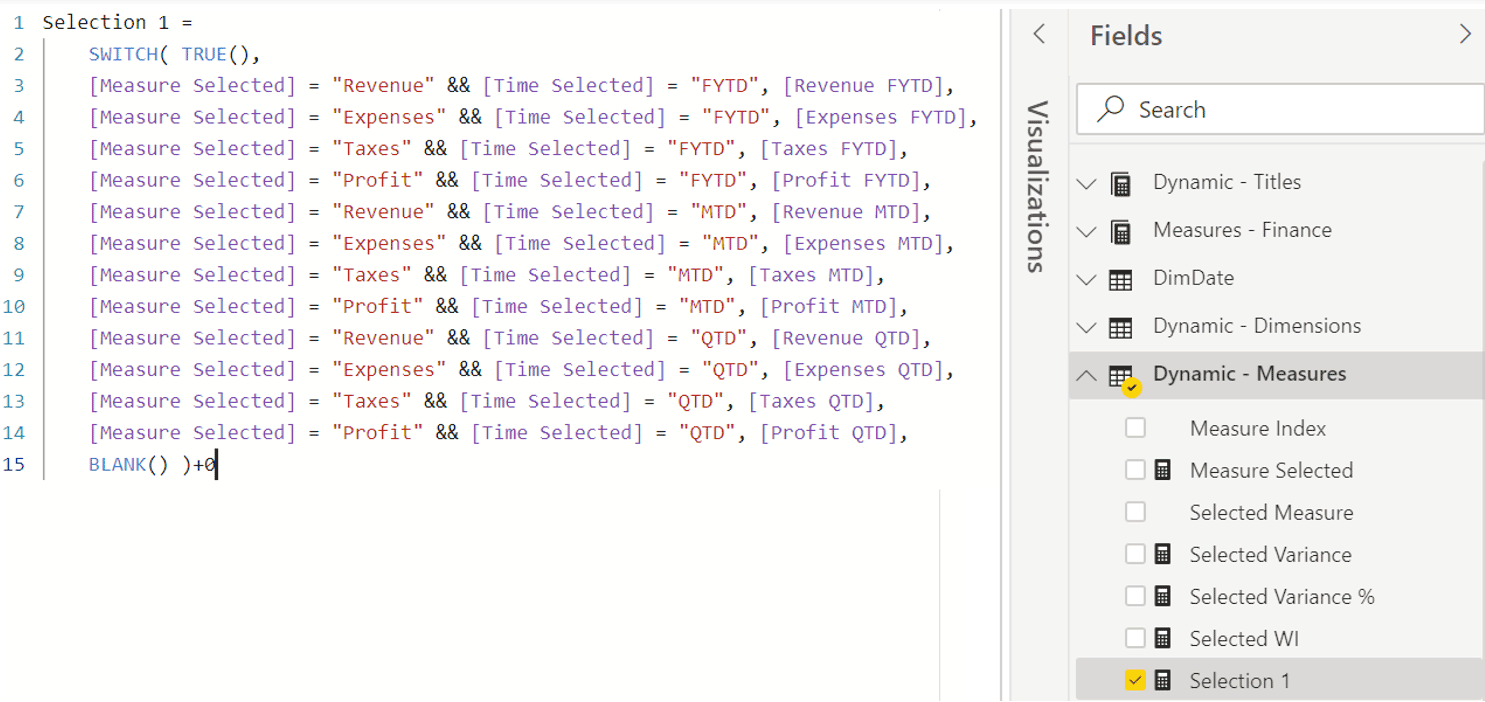
With all the setup now complete, we create the visuals for the report page using either or both the Selection 1 and Selection 2 measures and you’re done!
Summary
If you’d like to take your PowerBI Reports and Dashboards to the next level and need help, please contact us to discuss how we can assist your organisation.

Get the latest Talos Newsletter delivered directly to your inbox
TECHNOLOGY PARTNERS
Our partners including Microsoft, UiPath, Databricks & Profisee enable us to deliver business outcomes using best of breed technologies and solutions.

Automation & Analytics Technologies for Business

Australian councils face backlogs, staff turnover, and rising community expectations. We help you improve service delivery and operational efficiency through process automation — integrated with TechnologyOne, Civica, and Pathway.

Talos helps organisations build modern data and analytics platforms using Databricks, Microsoft Fabric and Power BI. We work from strategy through implementation, ensuring you get value from the platform without unnecessary complexity.
Talos helps organisations build reporting solutions using Jet Analytics