Published: 03 Jul 2018 | Author: Matthew Oen
In this series, we take a look at some of the Power BI custom visuals available on the Office store , and shed a light on what the visualisation is, how the Table Heatmap works and the impact it can have in a Microsoft Power BI report.
For the most part, data visualisation delivery is less of a science, and more of an art. If given a set of data, it is up to the artist to determine in what way that data will be presented, such that its appeal to the reader is so strong that it can influence decision making within an organization.
For that reason, Power BI has an expanded list of custom visuals to help data artists craft the masterpiece. It turns complex and unengaging data into an impactful and effective source of information that decision-makers can rely on.
Good Data Strategy dictates that an effective endpoint for data analysis is the point at which insights can be actioned as part of an informed decision. What ignites those insights are strong visualisations that tell clear narratives. One such visualisation is the Table Heatmap:
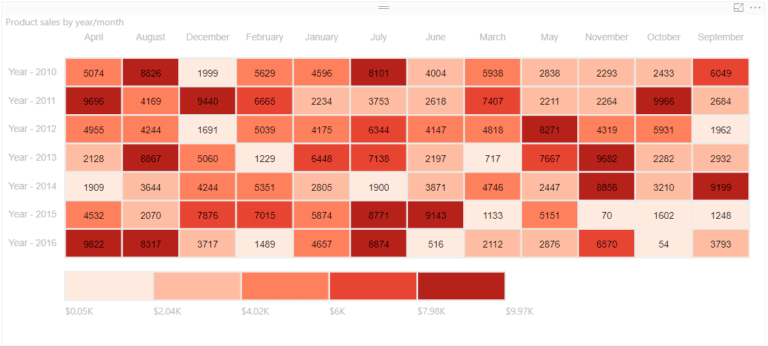
Table data can be easy to understand, but difficult to read. Rows of numbers appear the same, differences between figures are not obvious, and the overall message that the table intends to tell has become altogether unclear. By adding a colour-schemed heat map, however, users can see behind the numbers and quickly identify differing levels of relative performance without having to perform mental gymnastics. This ability to visually discriminate numbers is increasingly becoming crucial in making prompt and effective business decisions.
The Table Heatmap takes a simple table and turns it into a visually compelling and dynamic source of information for decision making. Combining the intuitive format of a table with the instinctive nature of a colour gradient, this visualisation makes for a far more effective representation of information without overwhelming or misinforming users.
Typical use cases include:
As a bonus, the colour scheme can be customized to match corporate colours, adding unique and impactful personalization to the visual.
By adding a heat map to a table, users can expect to instantly identify areas of interest or concern, empowering them to make informed decisions about their business. By harnessing the power of colour gradient perception, the Table Heatmap will prove useful in analysing operations, determining where resources need to be allocated and understanding performance patterns.

Get the latest Talos Newsletter delivered directly to your inbox
TECHNOLOGY PARTNERS
Our partners including Microsoft, UiPath, Databricks & Profisee enable us to deliver business outcomes using best of breed technologies and solutions.

Automation & Analytics Technologies for Business

Australian councils face backlogs, staff turnover, and rising community expectations. We help you improve service delivery and operational efficiency through process automation — integrated with TechnologyOne, Civica, and Pathway.

Talos helps organisations build reporting solutions using Jet Analytics
Talos helps organisations build modern data and analytics platforms using Databricks, Microsoft Fabric and Power BI. We work from strategy through implementation, ensuring you get value from the platform without unnecessary complexity.