Published: 26 Aug 2019 | Author: Matthew Oen
Although they may have more interesting stories to tell, museums are no different to any other organisation when it comes to the need for management system reporting. Where most businesses require comprehensive reporting from their ERP, a museum needs to be able to extract the data from their collection management system and craft a report that effectively informs management about the status of the objects in their collections catalogue. So they needed some EMu PowerBI reporting to help do this.
FTS Data & AI were recently tasked by a museum with the delicate job of developing collections reporting from the museums’ EMu Collections Management System (EMu), a collections management system specifically designed for museums and historical institutions. This museum was undertaking an assessment program, reviewing and recording object information on their entire collection of over 100,000 historical artefacts. Monitoring the progress of this program was vital for management, as it informed them about timelines, capabilities and project resource planning.
The Problem
As previously mentioned, EMu is a collections management system specifically designed for museums. The rich data that is maintained within this system must first be extracted in order to reap the reporting rewards. However, this is easier said than done. EMu’s Texpress database engine, ODBC connectivity and ADO RecordSet connectors are not exactly conducive to PowerBI or a modern reporting outcome. So Emu PowerBI reporting is not as simple as for some systems.
Instead, a more sophisticated approach was required to extract the data. As part of the museums’ commitment to public transparency, they had developed a modern GraphQL web API that could serve collection information. Developed in-house, data was first extracted from EMu using a Harvester program which then wrote into a MongoDB cluster that serves the API. After careful examination, we identified that this API could be used to meet the reporting requirements of the assessment program. A custom query was then written, and Power BI was able to successfully connect and pull the relevant data needed for reporting. The extracted data, in JSON format, was then cleaned and transformed into a working, healthy dataset.
The Report
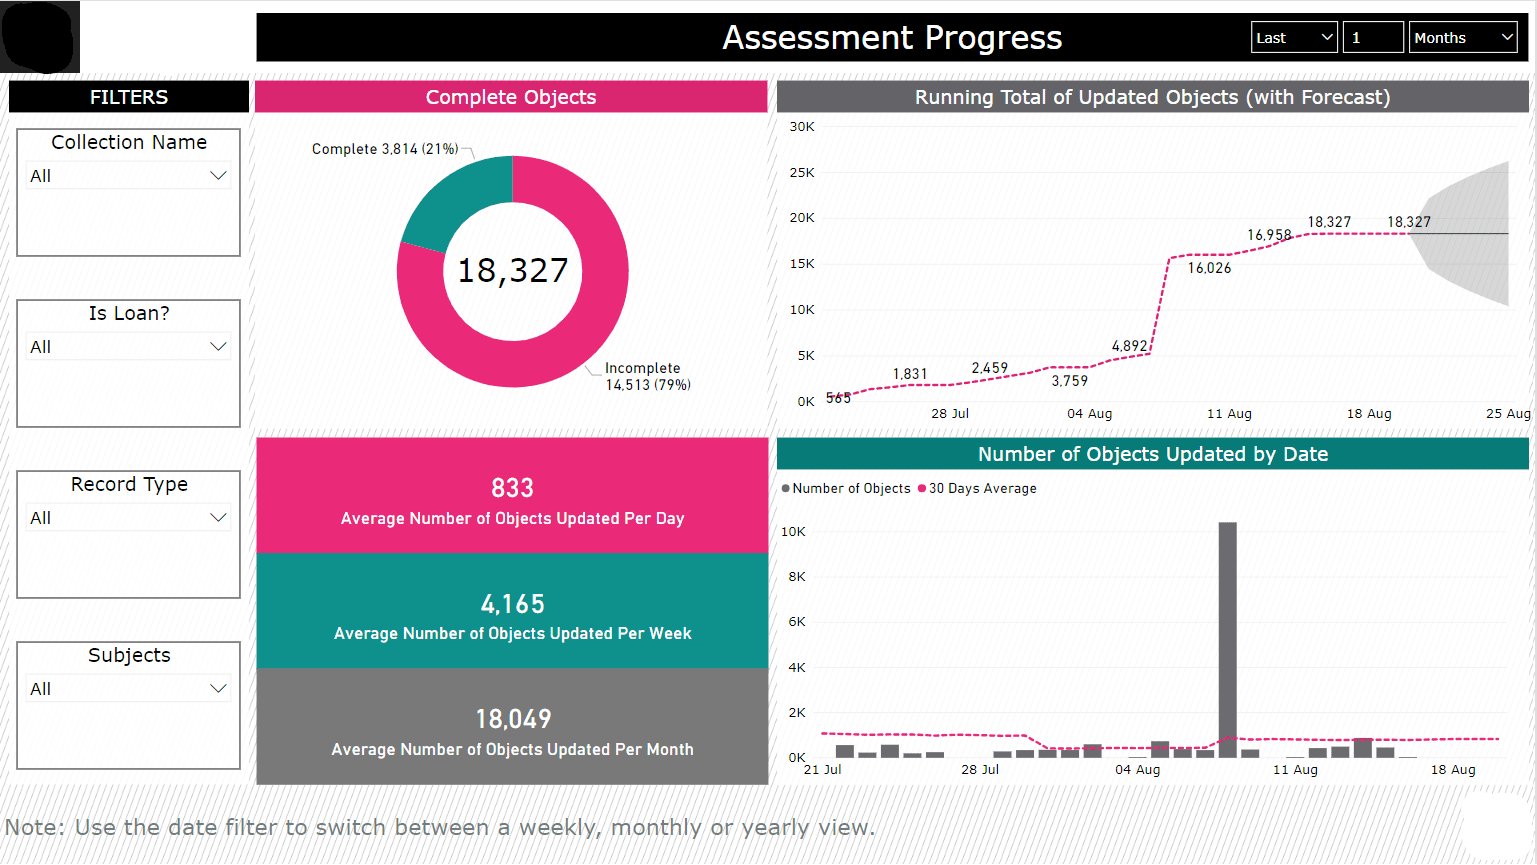
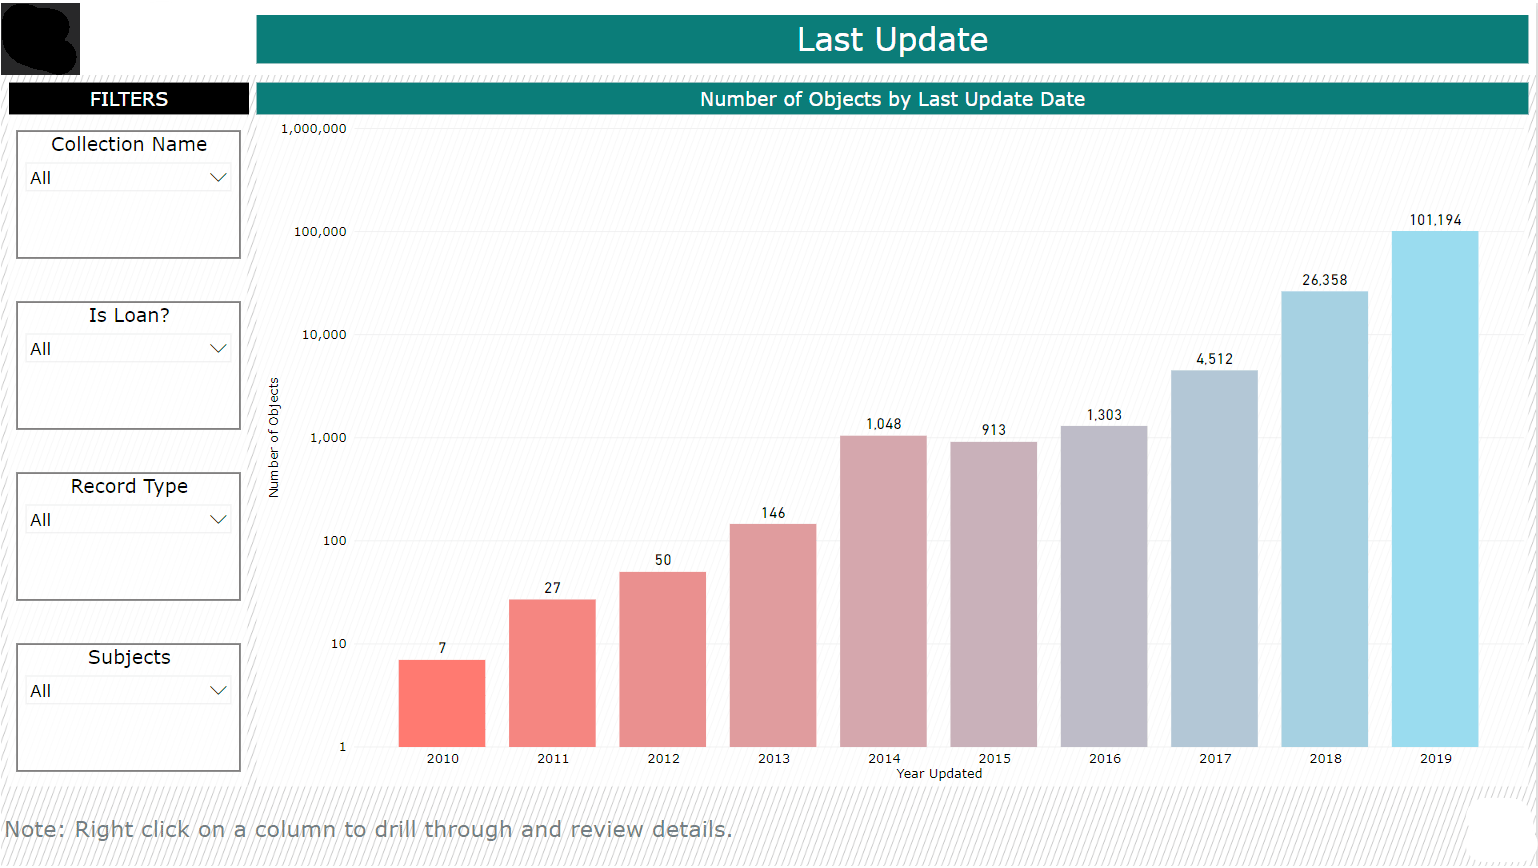
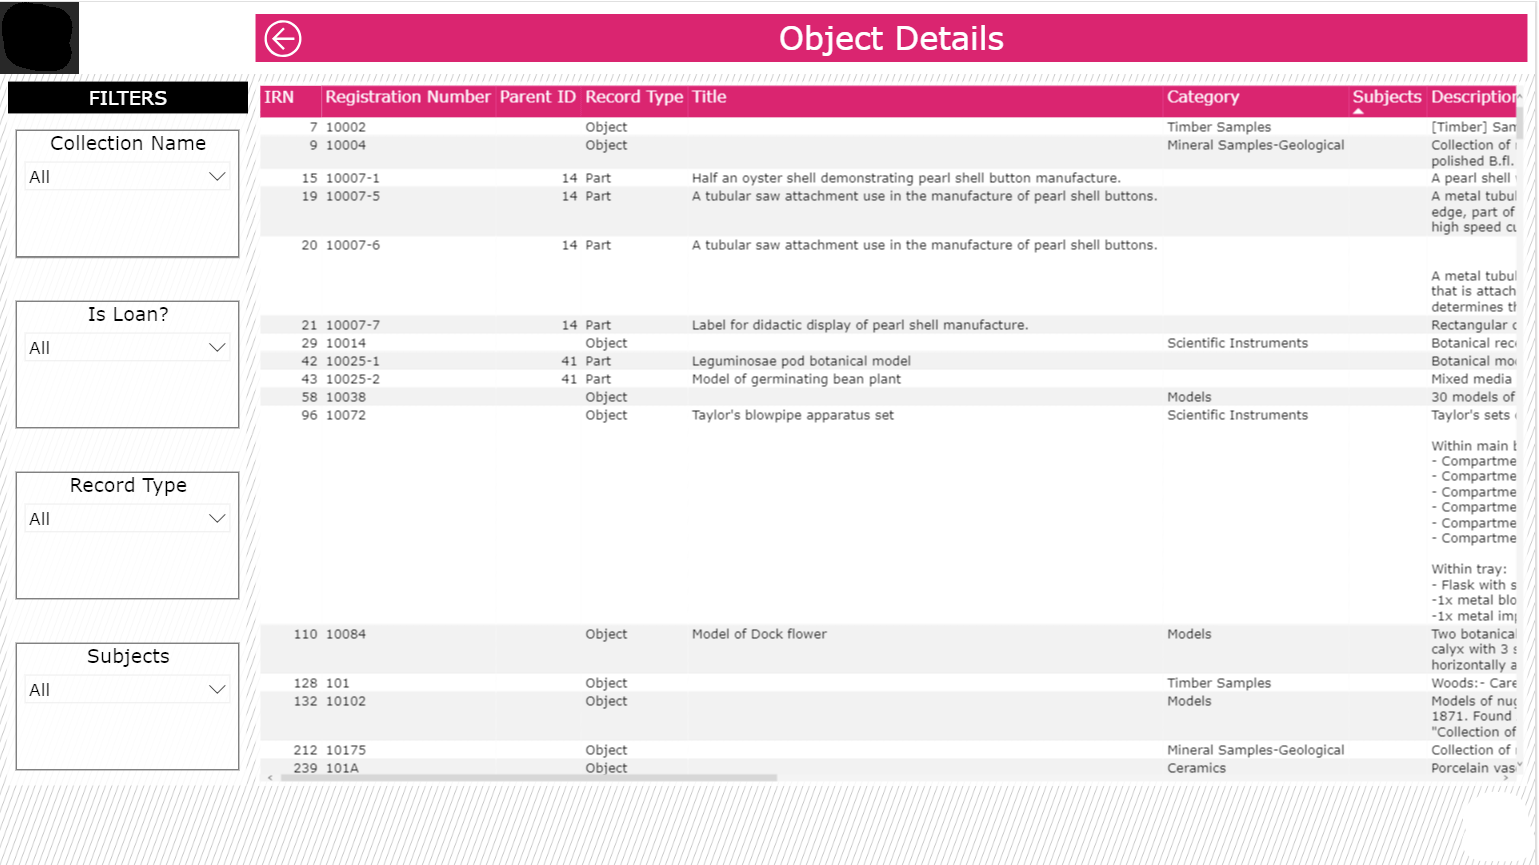
The report design was driven by our understanding of user workflow. An overall dashboard page, followed by a heat-formatted column chart, which then drilled through to the object details report page created a natural reporting rhythm that could be easily interpreted by report consumers:
Custom functionality including filtering, formatting and forecasting meant that additional insights were gleaned from the dataset. We were able to not only report on the progress of the assessment program, but also provide guidance as to what objects the collections team should review and assess in the next month, proving incredibly useful in managing the resources needed in the project.
The Outcome
Starting with careful data excavation via the GraphQL API, then continuing with the injection of focused reporting design principles, we ultimately end with a sophisticated collections reporting experience that meant that the museum could leverage their existing EMu collections management system with a modern reporting tool to locate efficiencies in a large internal project.
If you have a reporting challenge and need help, please contact us to discuss how we can assist.


