Published: 10 Jan 2019 | Author: James Beresford
The D365 FinOps Reporting landscape is a bit tricky to navigate. The documentation has not keeping up with the pace of product development. This makes the technical complexities difficult to navigate. In this quick post we provide an overview of what options you have. Dynamics 365 Finance and Operations (aka D365 FinOps) is a powerful ERP that can significantly improve business process efficiency, but for us at Talos, we also see that there is a lot of additional value to be obtained from the data it captures.
The three key tools within the D365 FinOps Reporting suite are:
There is also a fourth way – which is to pull the data out (aka BYOD or Bring Your Own Database) and report on it with whatever you like, but that’s for another post.
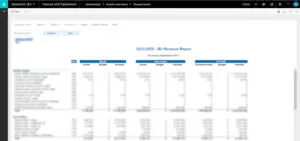
The simplest option – Financial Reporting (previously Management Reporting) – has a designer built into the D365 environment. It’s purpose is to provide Management Financial Reporting – i.e, Balance Sheet, Cash Flow, P&L – with some ability to customise your financial reports to your organisations viewpoint, with some filtering available for operational segments.
However its key limitation is that it is Financial in nature only and geared towards providing fairly static, statutory type reporting. Add to that the design and build of reports is very manual and it quickly reaches its limits. A typical example of such a report is shown below – you can see it is very much geared towards line item summaries.
D365 Finance Report Writer
PowerBI is planned to be the key reporting tool for D365 and may well replace the other options over time. A significant number of the embedded reports are already built in PowerBI. Part of any D365 Subscription is a PowerBI Embedded instance. All of the PowerBI reports in D365 are managed through this. Typically the generic reports do not suit the individual business needs and thus they need customising or extending. This is possible – complex to get started – but simple enough to execute once initiated, for example leveraging our Enterprise PowerBI team who have deep experience doing this. Below is a “Before & After” set of examples to show the difference between out of the box reports and ones that have been enhanced by our team.
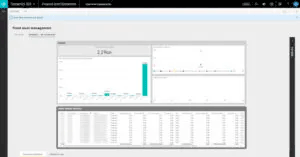
D365 FinOps PowerBI Report – Before
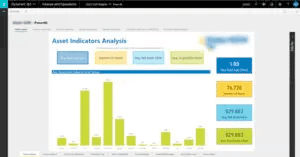
D365 FinOps PowerBI Report – After
A key restriction is that the embedded reports have to run off of the data in the Entity Store. This is a subset of the data in D365, with predefined and scheduled aggregations. To add content to the Entity Store requires a D365 developer, which adds cost to the report development process.
In every module in D365 there is a substantial set of SSRS reports that are included under the name of “Document Reporting Services“. These are embedded into D365 and present views of data with very simple parameters. You can view the technical details of included reports here and there are at least a thousand of them.
As with the PowerBI option it is possible to customise, brand and extend these reports. In this case the data source is any query that can be written against the Application Object Tree (AOT). Importantly this can show transactional as well as aggregate views. This allows for the production of customer facing content such as invoices.
So there are three options, each with their quirks:
It’s not the clearest or most well documented landscape to navigate, but it is generally possible to produce the content you need to meet your organisations reporting requirements.

Get the latest Talos Newsletter delivered directly to your inbox
TECHNOLOGY PARTNERS
Our partners including Microsoft, UiPath, Databricks & Profisee enable us to deliver business outcomes using best of breed technologies and solutions.

Automation & Analytics Technologies for Business

Talos helps organisations build modern data and analytics platforms using Databricks, Microsoft Fabric and Power BI. We work from strategy through implementation, ensuring you get value from the platform without unnecessary complexity.
Talos helps organisations build reporting solutions using Jet Analytics

Australian councils face backlogs, staff turnover, and rising community expectations. We help you improve service delivery and operational efficiency through process automation — integrated with TechnologyOne, Civica, and Pathway.