Published: 20 May 2020 | Author: Matthew Oen
Azure DevOps (ADO) is fast becoming the application lifecycle management tool of choice for modern organisations. With boards, CI/CD pipelines and Git repo capabilities, Agile practices have never been so easy to implement in project management. However, as a DevOps tool, it is understandably not designed and equipped to be a fully-fledged reporting and analytics solution as well. Luckily, Power BI can be used to integrate with ADO to deliver the kind of enterprise reporting that project managers need to properly monitor their projects. This blog post covers Azure DevOps Power BI reporting and also some examples of what kind of reporting is available.
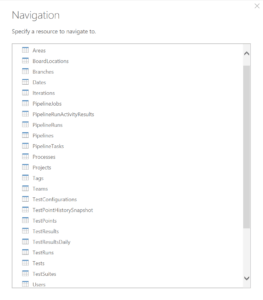
A connection to ADO is made possible via the OData feed option available in Power BI. Once connected, you will need to select the relevant tables to begin building a data model. For most project managers, the main objective in ADO reporting is getting clear visibility of the progress of work items. For that reason, the tables imported into the model should contain information relating to Work Items and Iterations.
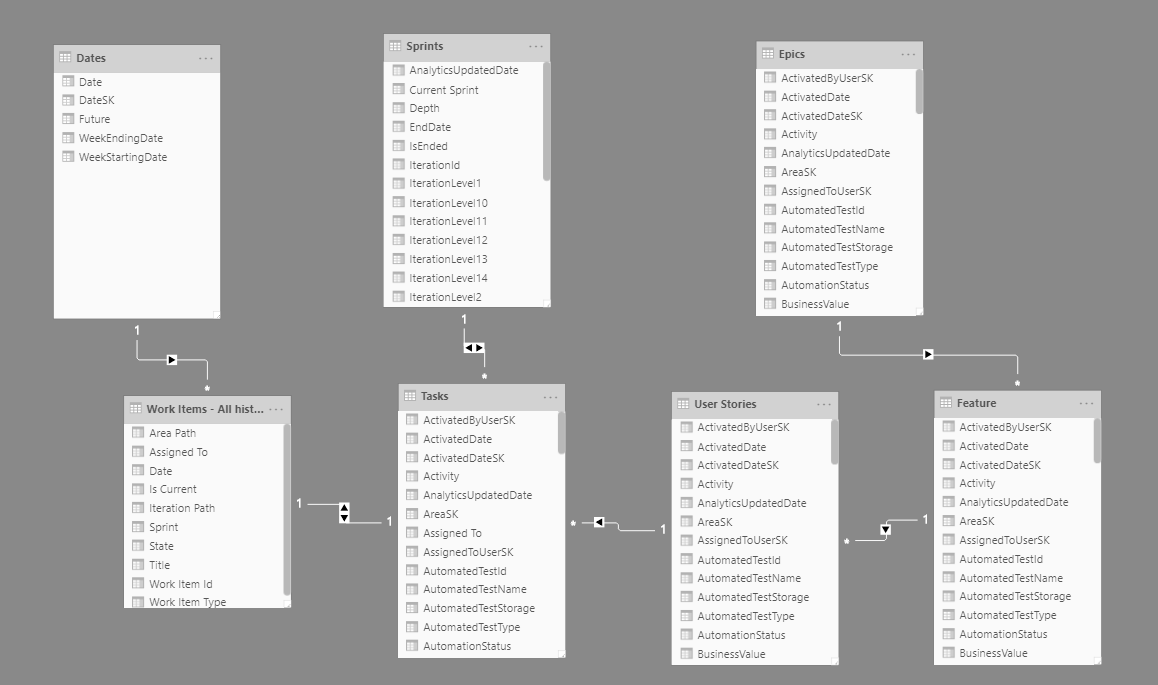
Once imported, some simple transformations are required to clean the data. It is crucial that the correct relationships are created between work item tables. This is because work items in ADO are hierarchical, starting with Epics, Features, User Stories and Tasks. This hierarchical logic must be captured in the model in order for the reporting to make sense.
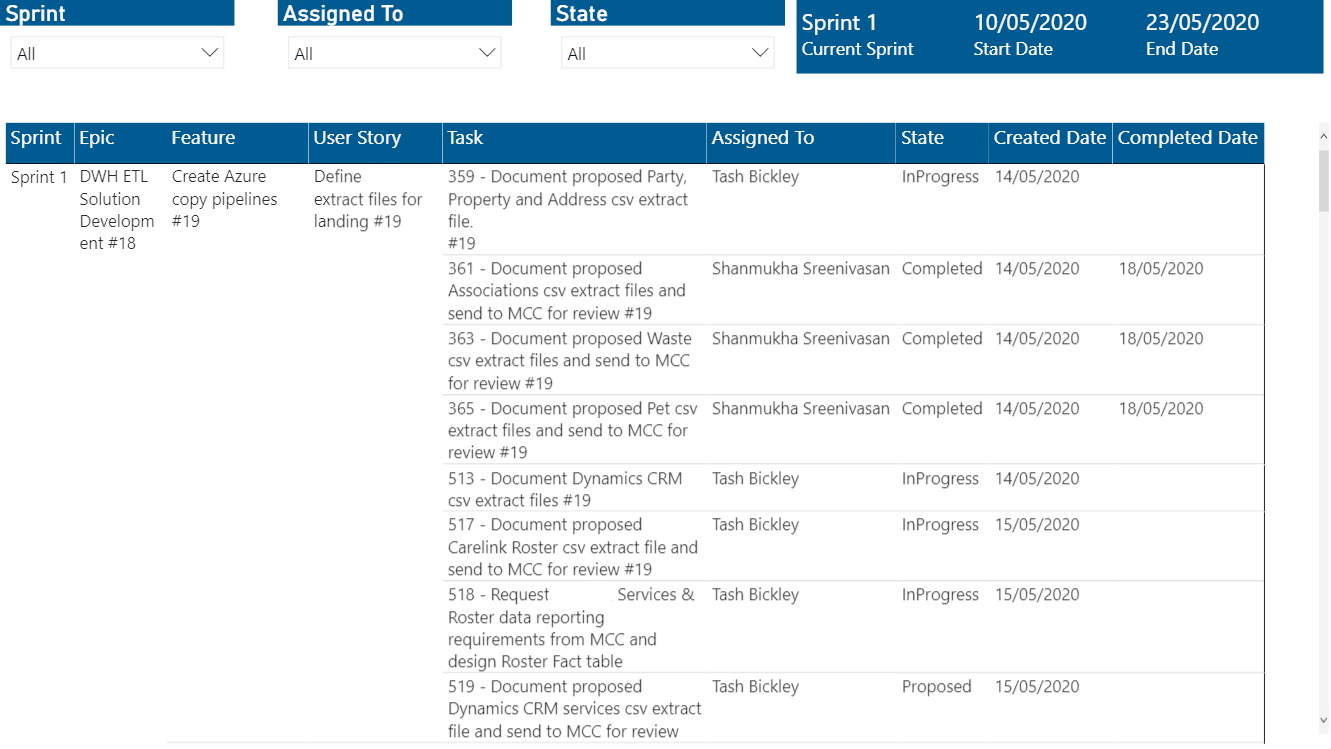
Once the model has been created, the report visualisations can be built. Based on experience, a clearly constructed table outlining key work item information including Sprint, Epic, Feature, User Story, Task, Assigned To, Completed Date, Task Number and Sprint Percentage is precisely what project managers want to see. Although not the most visually compelling report, these tables clearly articulate work progress in a single view, something not easily achieved natively within ADO.
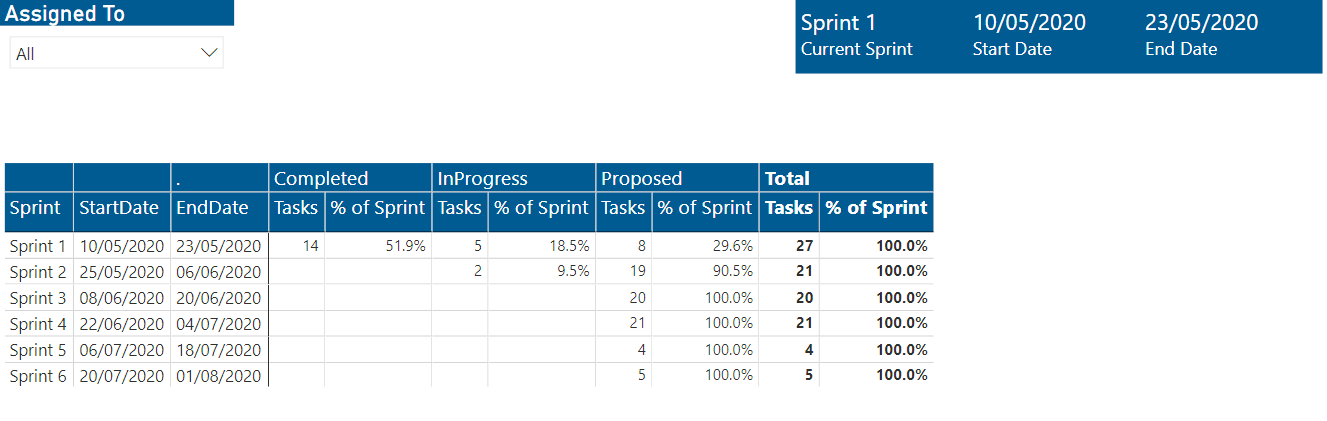
As mentioned previously, ADO reporting is primarily concerned with reporting on the progress of work items. However, the OData feed is able to capture most of the ADO backend, meaning that additional reporting on things such as pipelines and test results is also possible. Some typical reporting examples include:
Virtually any reporting can be custom built using Power BI and the OData feed.
Developing Power BI reporting for ADO is also useful because of its scalability. The OData feed can be re-pointed to any ADO instance, meaning that your reporting can be easily reproduced in other ADO instances. At FTS, we offer a pre-packaged report that can be easily implemented in any instance. It contains the most relevant reporting out of ADO based on our experience and has been very useful for us in managing our projects.
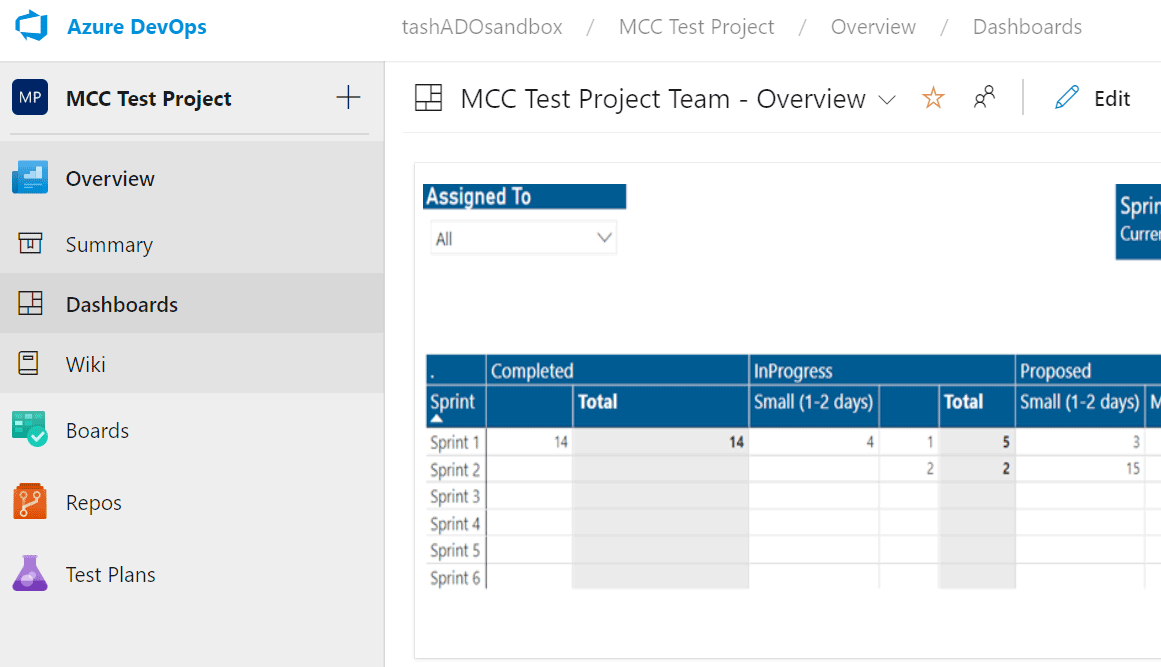
Finally, Power BI reports can be easily embedded back into ADO via the native web-embed functionality. A dashboard in DevOps must be first created, and include an iframe dashboard widget. Then the Power BI report can be embedded into the widget in the dashboard, thereby allowing you to view your custom reporting within the DevOps browser. This ability to embed reporting elevates ADO into being an all-in-one development management tool, greatly assisting project managers keep track of resources and progress.
If you want to begin Azure DevOps Power BI reporting, please contact us for more information.

Get the latest Talos Newsletter delivered directly to your inbox
TECHNOLOGY PARTNERS
Our partners including Microsoft, UiPath, Databricks & Profisee enable us to deliver business outcomes using best of breed technologies and solutions.

Automation & Analytics Technologies for Business

Talos helps organisations build reporting solutions using Jet Analytics

Australian councils face backlogs, staff turnover, and rising community expectations. We help you improve service delivery and operational efficiency through process automation — integrated with TechnologyOne, Civica, and Pathway.
Talos helps organisations build modern data and analytics platforms using Databricks, Microsoft Fabric and Power BI. We work from strategy through implementation, ensuring you get value from the platform without unnecessary complexity.